
One of our objectives with Tator is to enable you to explore, visualize, and edit your data efficiently. We will be taking a major step forward in fulfilling these goals with the upcoming rollout of the new Localization Analytics View.Within this view, you can filter and view the project’s drawn dots, boxes, and lines and their editable attributes.
Accessing the view
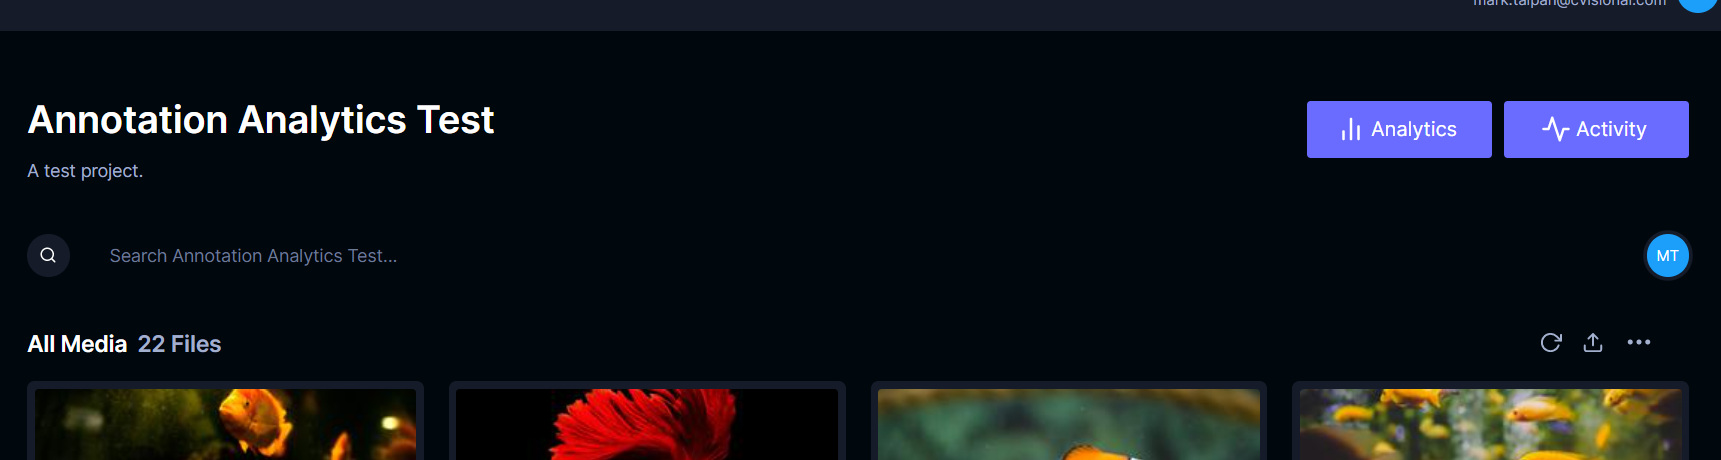
You can access the new view by clicking the Analytics button in the project detail view and selecting the Localizations button. This replaced the old Run Algorithm button. Algorithms can still be executed using the drop-down menus via the ellipsis more buttons.
Filter module
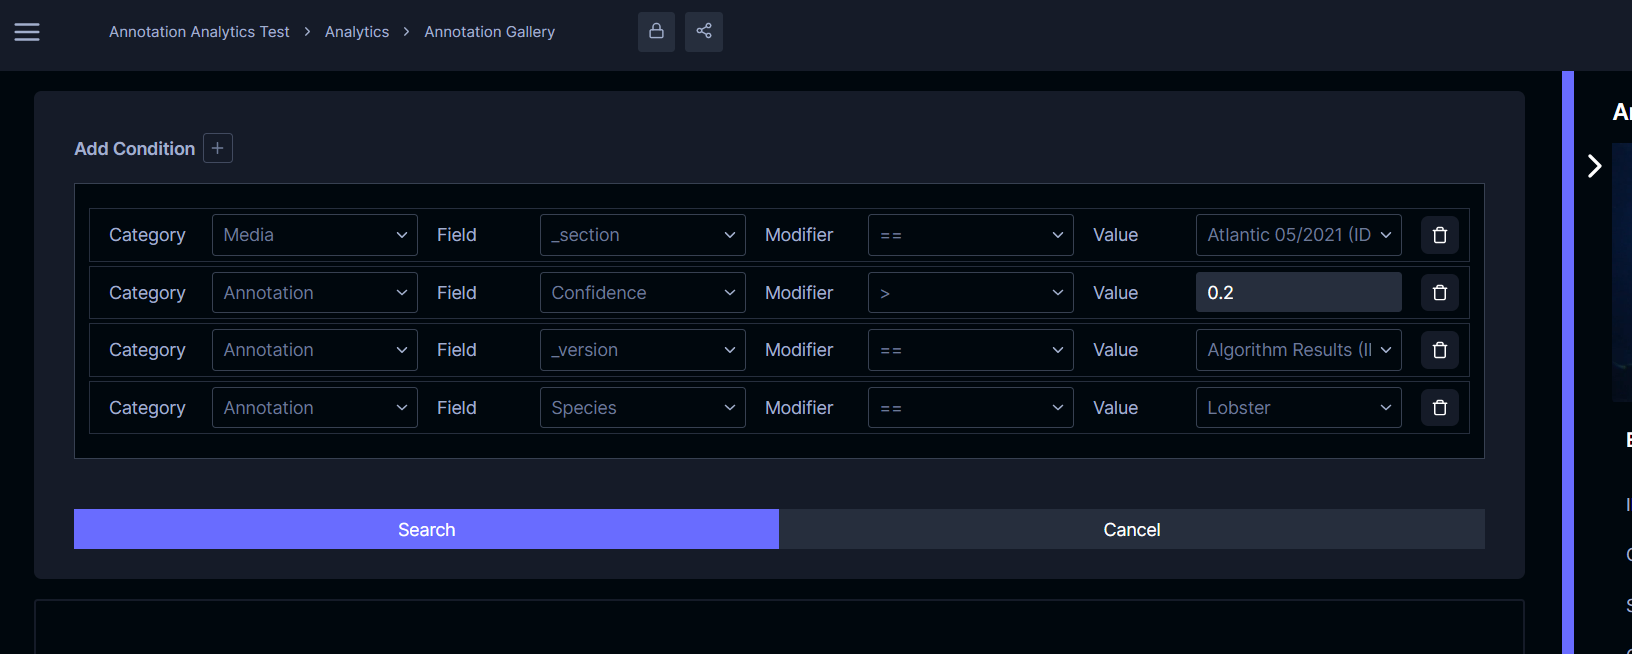
Querying the project’s localizations (i.e. drawn dots, boxes, and lines) is accomplished with the new Filter module. It is an interface of drop-down menus and input field options defined by the project’s settings. You can create a search filter using attribute conditions, sections, versions, and dtypes to find the data you want to inspect. For instance, the example above highlights a search filter that finds all the project’s localizations matching these criteria:
- Localizations in media that reside in the Atlantic 05/2021 media section
- Localizations whose Confidence is greater than 0.2
- Localizations in the Algorithm Results version
- Localizations whose Species equals Lobster
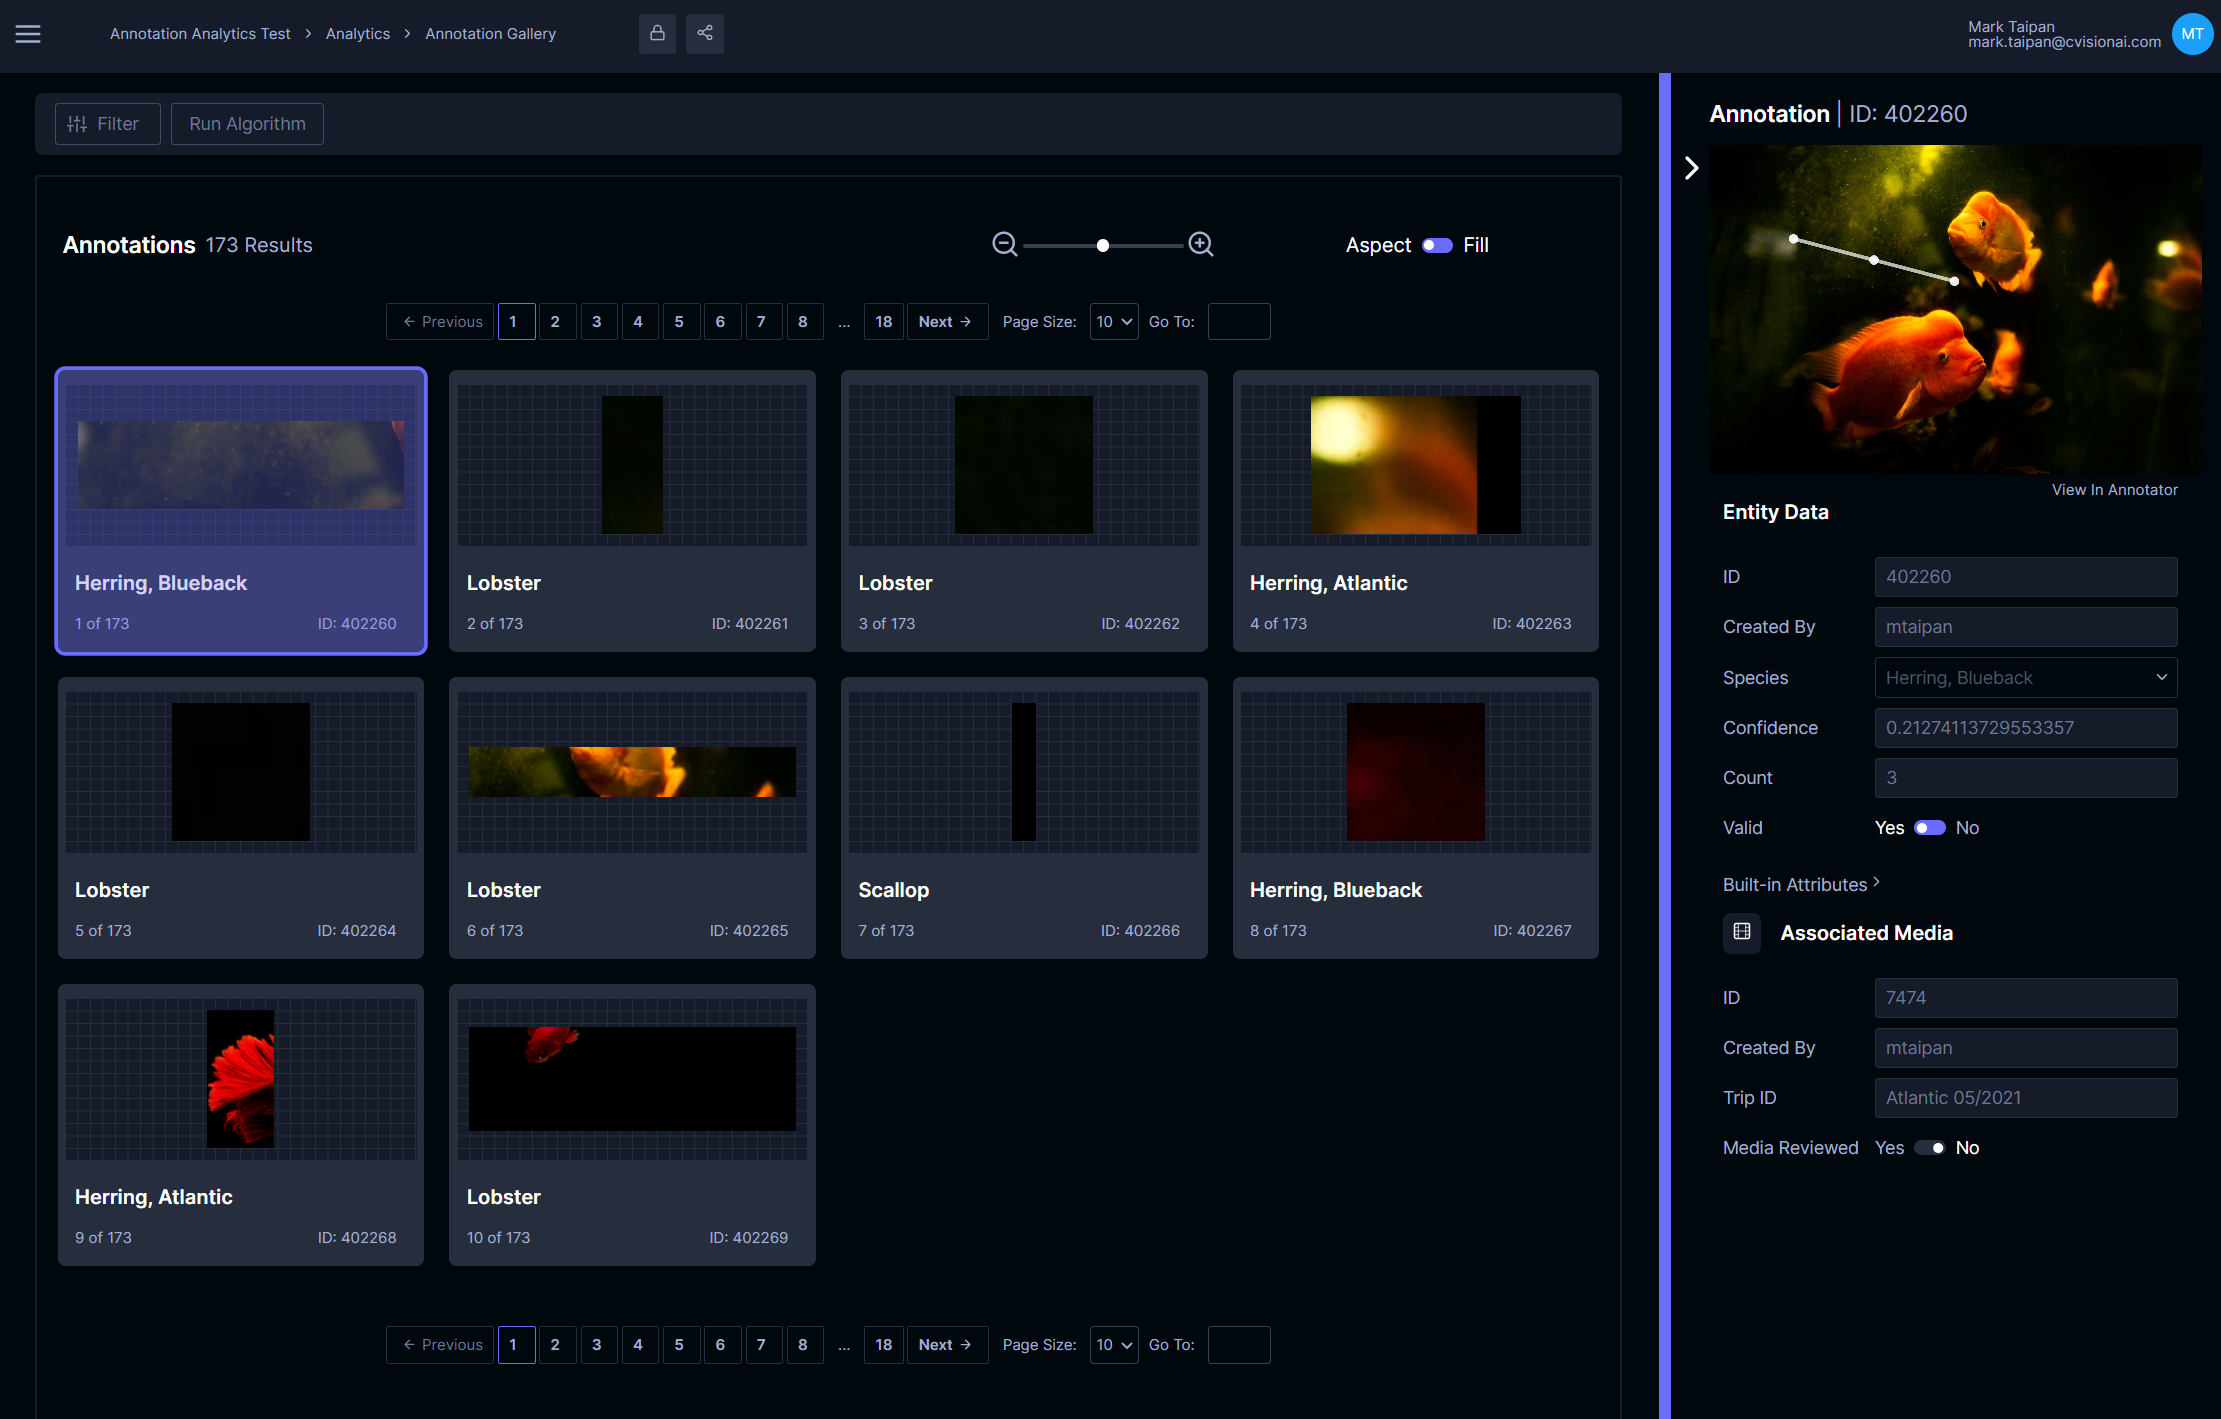
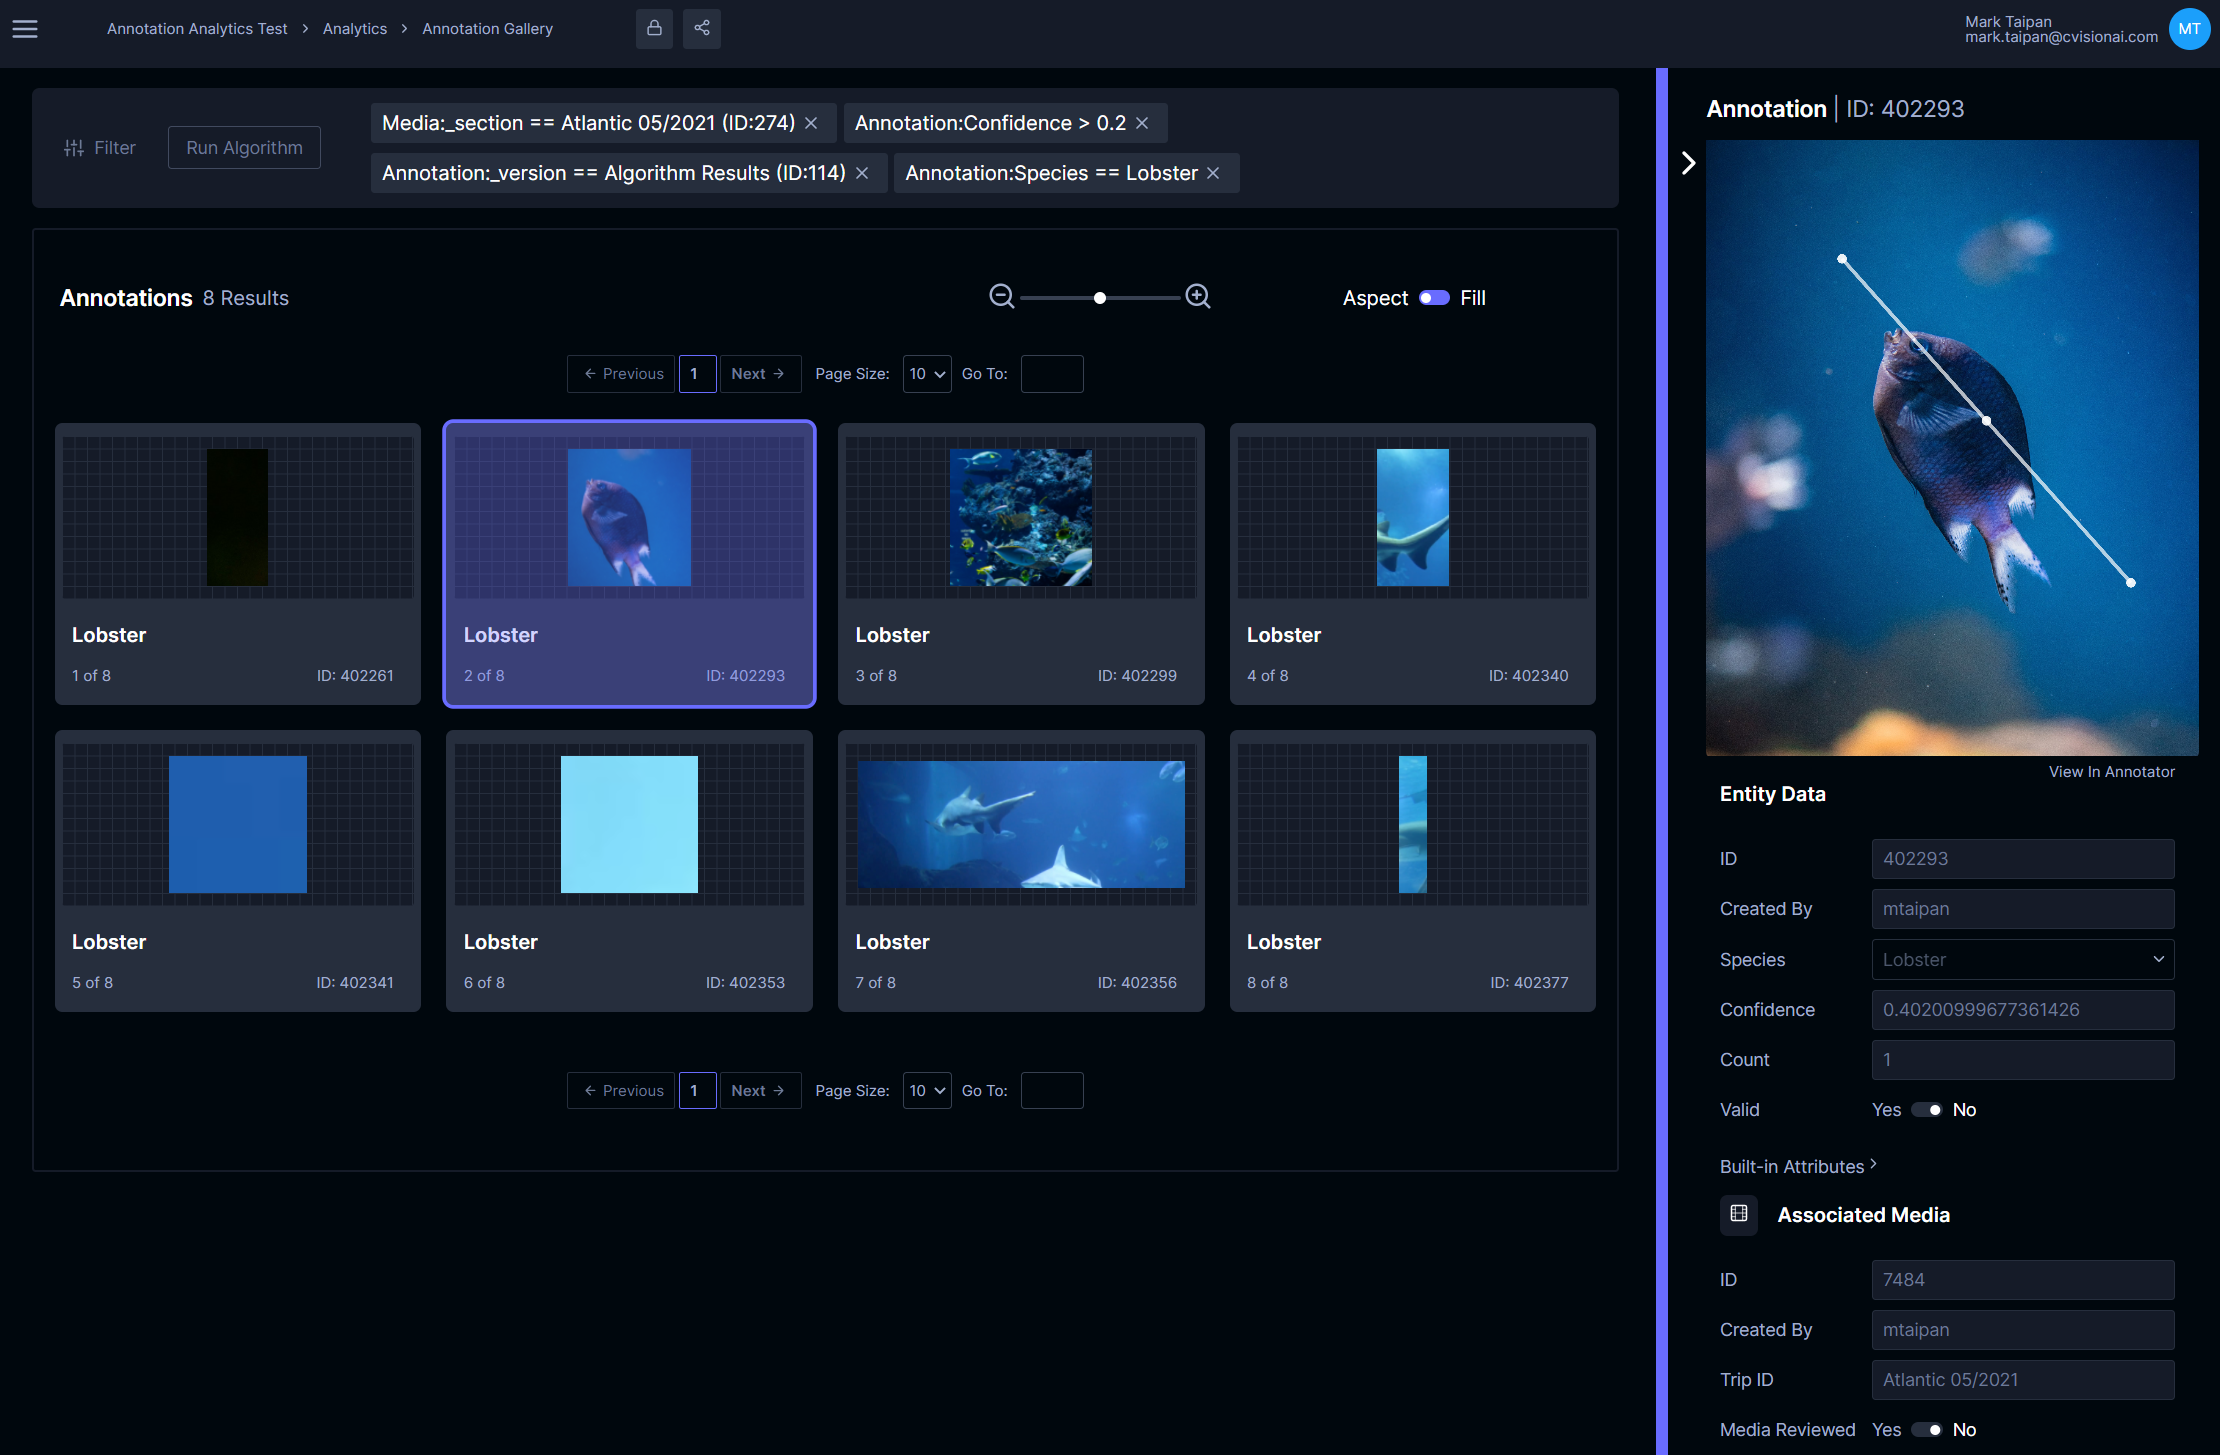
Gallery and entity panel
After selecting filter conditions and clicking Search, the matching localizations are displayed in gallery pages akin to the media gallery in the Project View. Within each card, the primary attribute is displayed, and a thumbnail of the localization is shown. The size of each card and whether to retain the aspect ratio of the thumbnail can be altered using the controls at the top of the gallery. Selecting on a card will pop open the Entity Panel with its data. The line, dot, or box is displayed within the image or video frame (like the Annotator View) to provide you context of the annotation. You can also edit its attributes, along with the associated media’s attributes, from this panel.
Path forward
We are excited to roll out this new capability and continue improving its feature set. Some upcoming features include:
- Visualizing tracks and media-associated states in a collection gallery
- Incorporating reports and data visualizations
- Improving the filter module with new filtering options such as searching within a date region and by GPS location
- Adding user-based and project-based Filter Favorites like the Localization Favorites in the Annotator View
Try it out
The Localization Analytics View will be rolled out with the new Annotator View soon. If you are on Tator Cloud, you can preview these new views now by visiting https://test.tatorapp.com. This preview deployment uses the same database services as tatorapp.com, so you log in with the same credential and can annotate as you normally would. We do not recommend using it for launching workflows, uploads, or custom scripts.