Localization analytics
Tator’s localization analytics view allows you to explore and edit the project’s localizations. This tutorial will explain how to use this view to filter and retrieve the project’s localizations, visualize them, and edit their attributes. To begin, localizations must have been added to the project using a Tator client such as tator-py or by drawing them using the annotator view.
Accessing the view
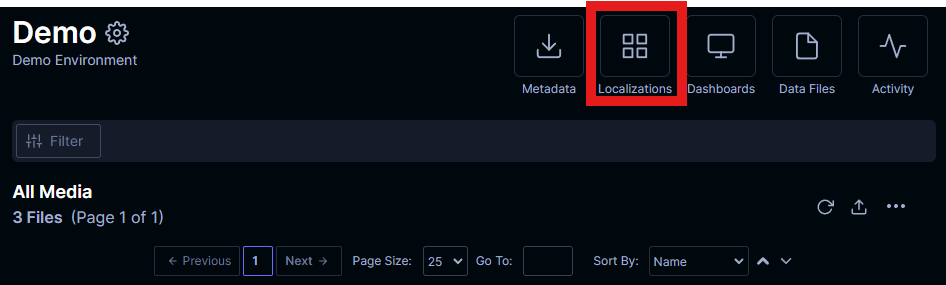
You can access this view by going to the project detail view and clicking the Localizations button. This will bring you directly to the localization gallery.
Filter Interface
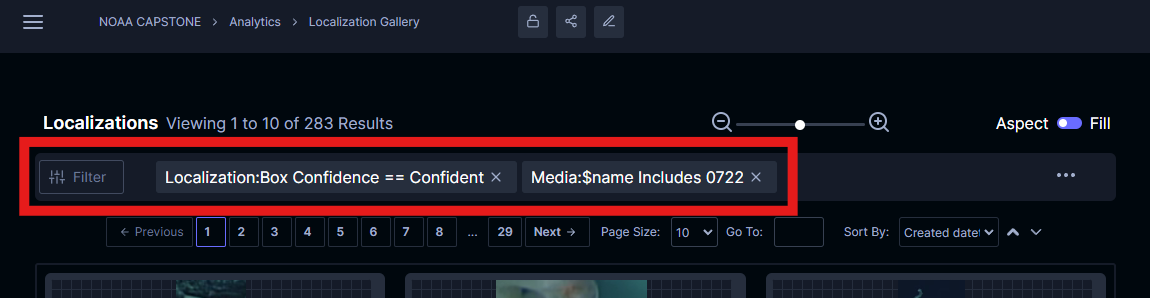
At the top of the page, click on the Filter button and apply filter conditions to see a subset of the project’s localizations. If no filter conditions are applied, all the project’s localizations will be displayed within the gallery. See this tutorial for more information about using the filter interface. When a filter is applied, the localization list matching the filter set are displayed within the gallery.
Gallery
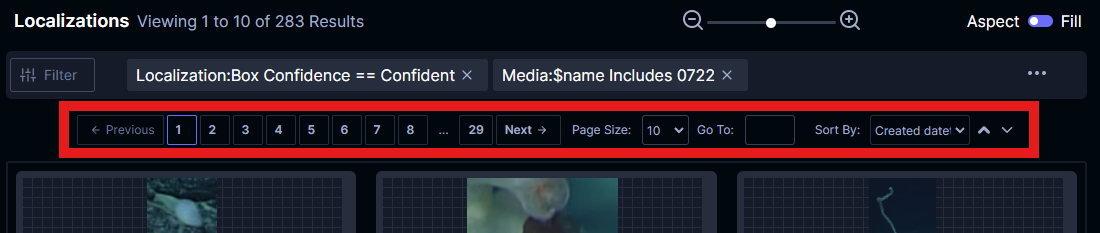
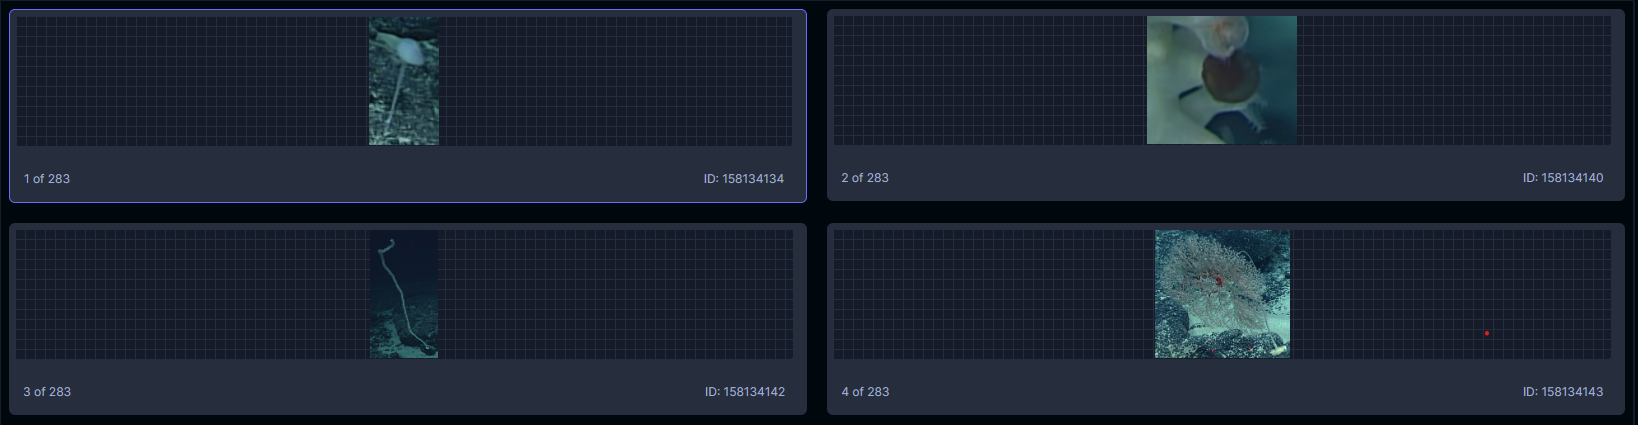
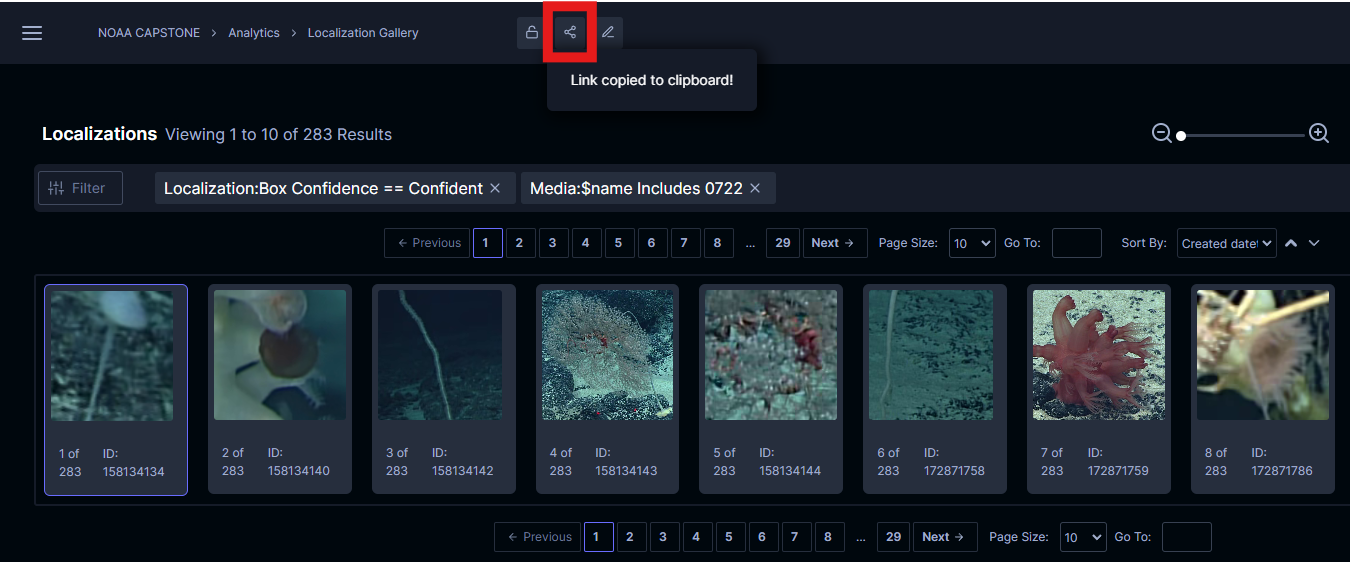
The localization gallery displays all the localizations matching your selected filter conditions. Like the project detail view, the localizations are split up into pages accessible by the page controls located at the top and bottom of the gallery. If you wish to view more entries per page, use the Page Size menu and select your choice. Whenever you change the page or the page size, the filter conditions are re-applied and the corresponding list of localizations will be displayed.
Localizations are displayed within the gallery using cards. Each card contains the localization’s thumbnail, its unique Tator ID, its position in the overall filtered list, and the first attribute with an order of 0.
You can alter the size of the thumbnail cards using the resize handler at the top of the gallery.
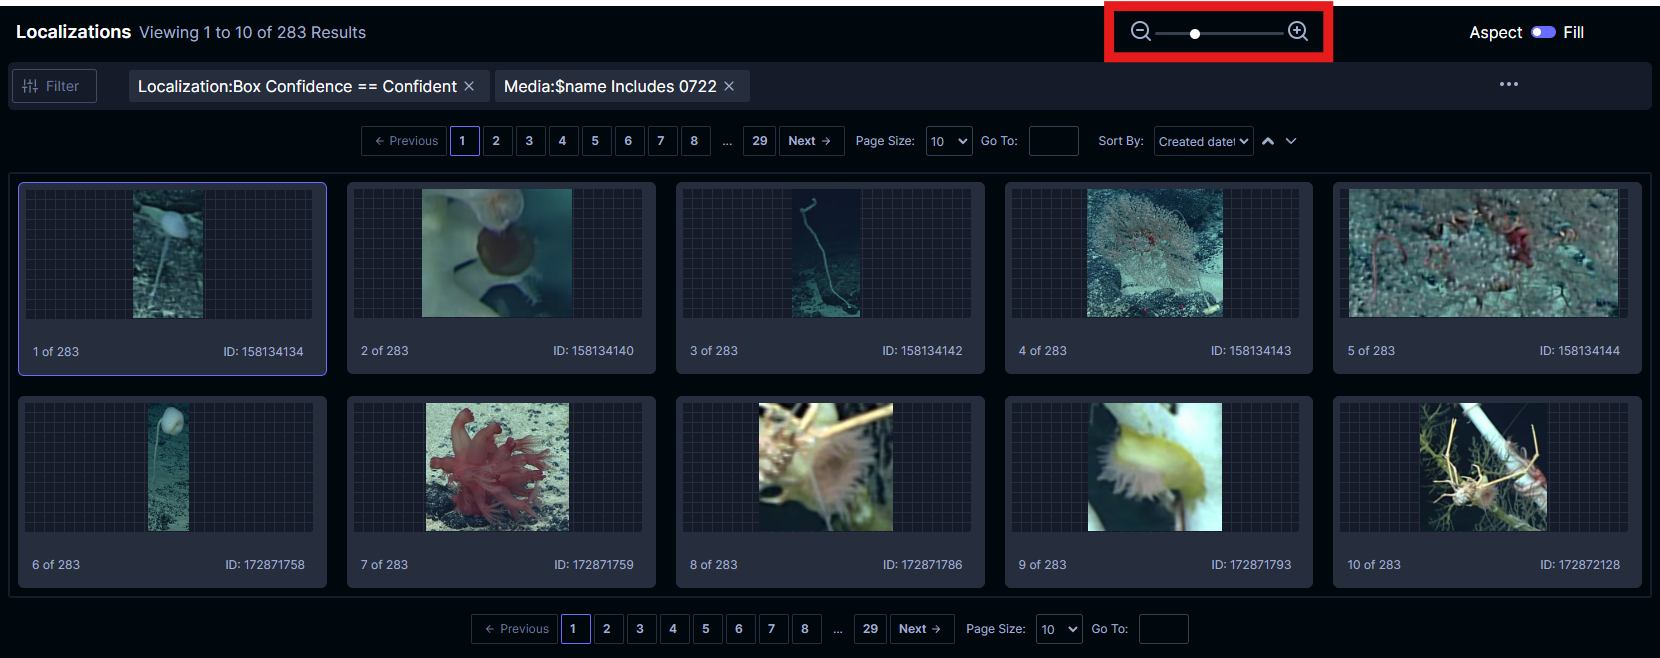
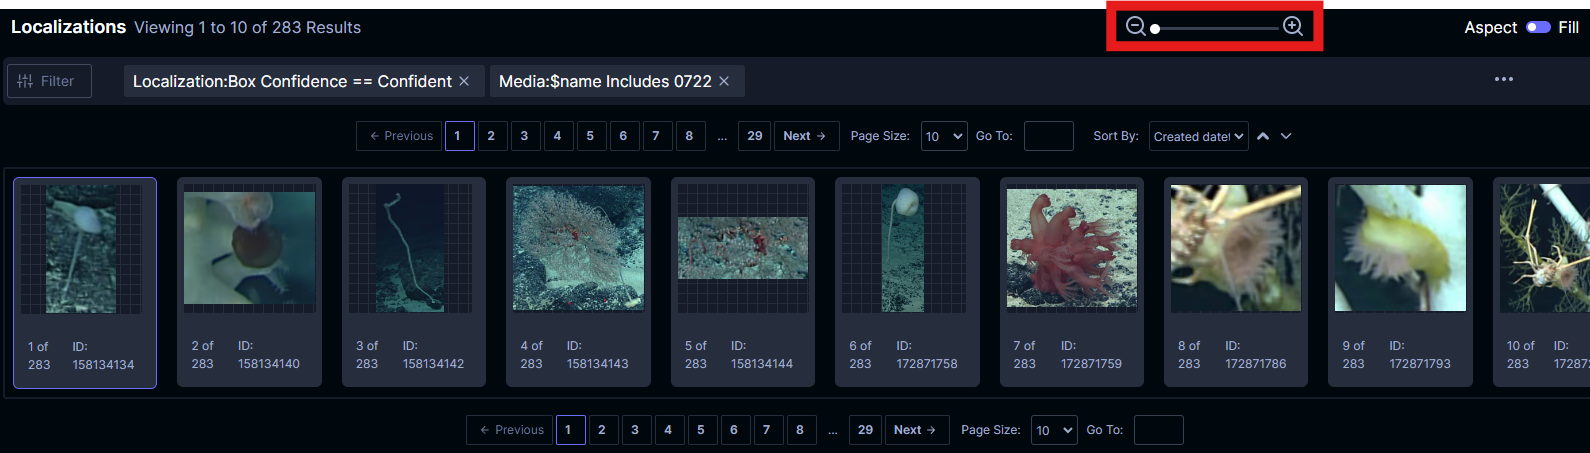
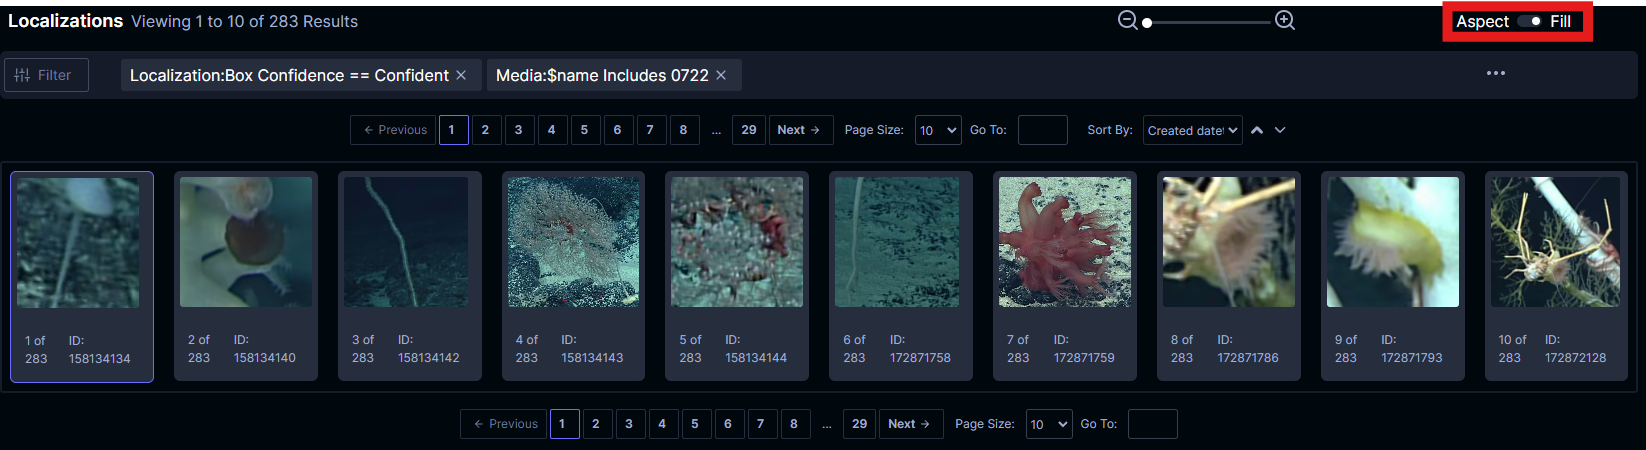
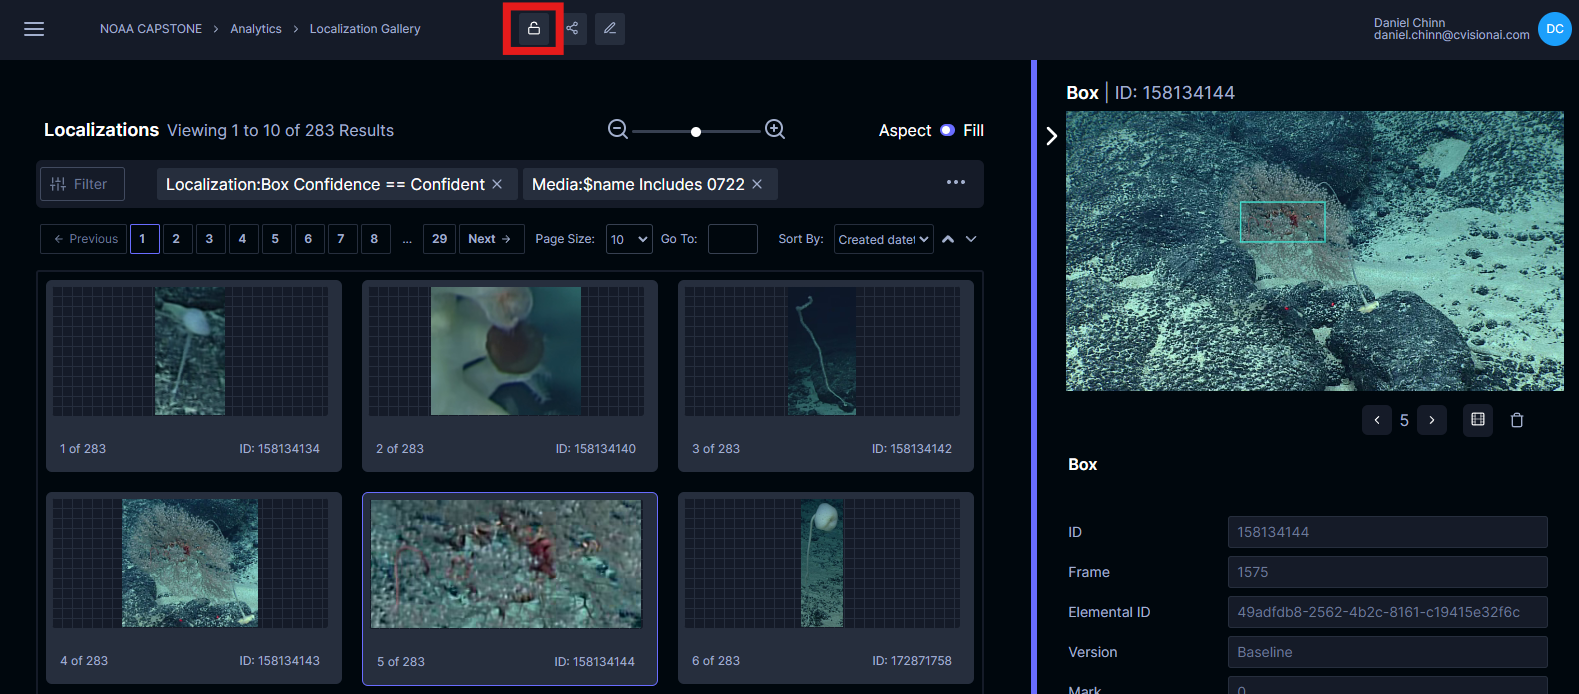
By default, the localization thumbnails retain their aspect ratios. This can be changed to fill the available card space by using this button at the top of the gallery.
To share a link of the current page and filter conditions, click on the link button at the top of the page. This behaves similarly to the annotator view; after the link is copied it can be pasted using typical text paste options.
To view more information about a localization, click on the card. The localization panel on the right of the web page will be filled in with its corresponding information.
Localization Panel
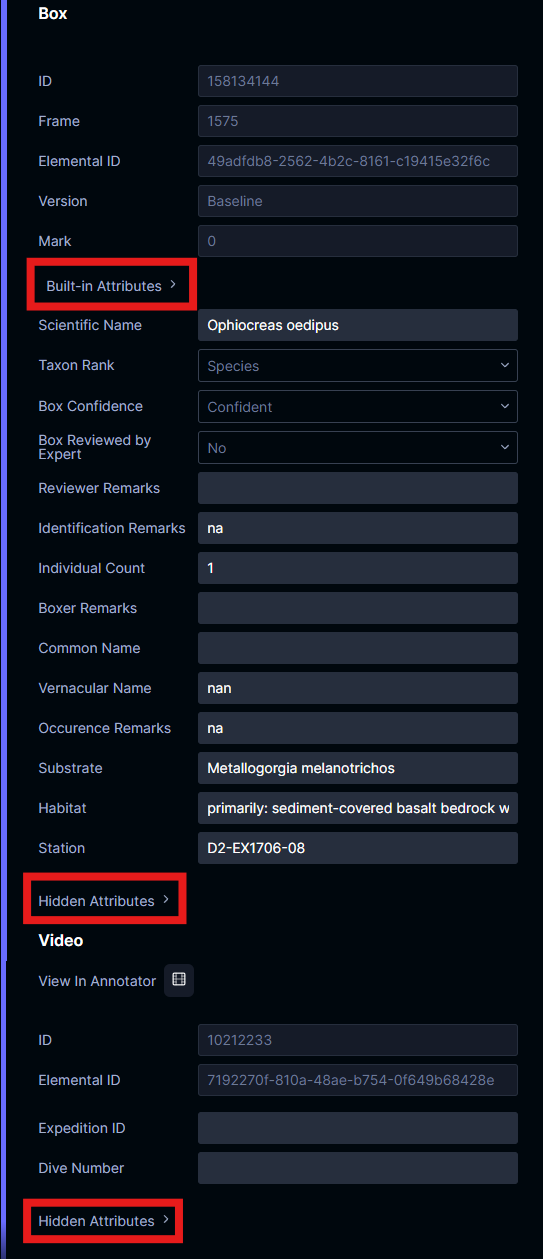
The panel on the right displays your currently selected localization and its associated data. At the top of the panel is an image of the localization within the corresponding media. This can help provide visual context to the localization. The localization’s dimensions and position cannot be changed nor can it be deleted within this analytics view. You can re-position, re-size, or delete the localization in the annotator view by clicking on the View In Annotator button.
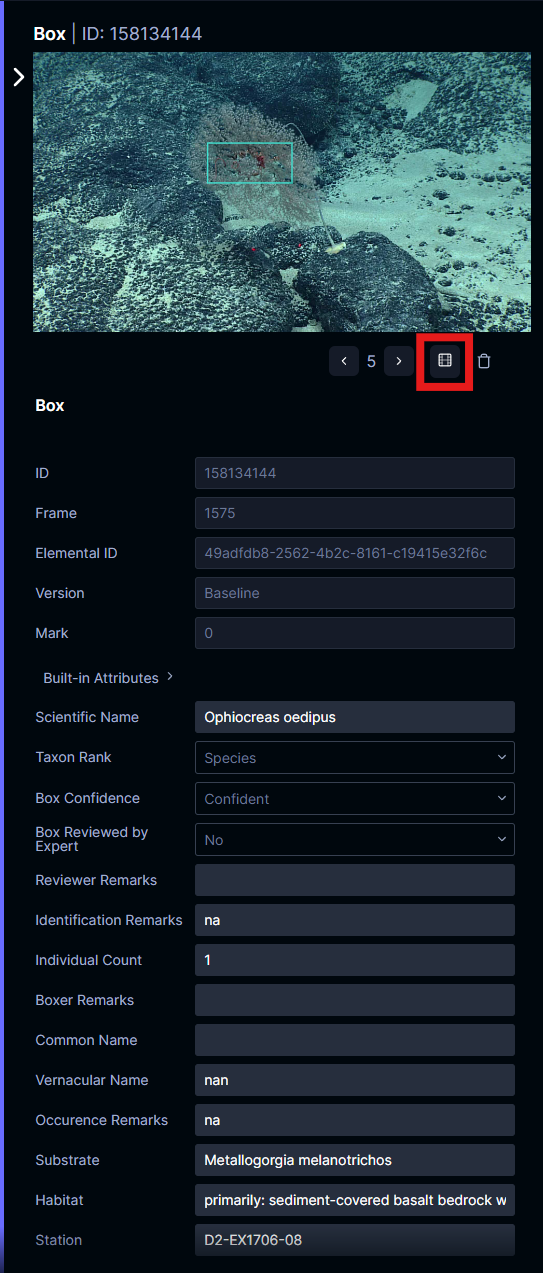
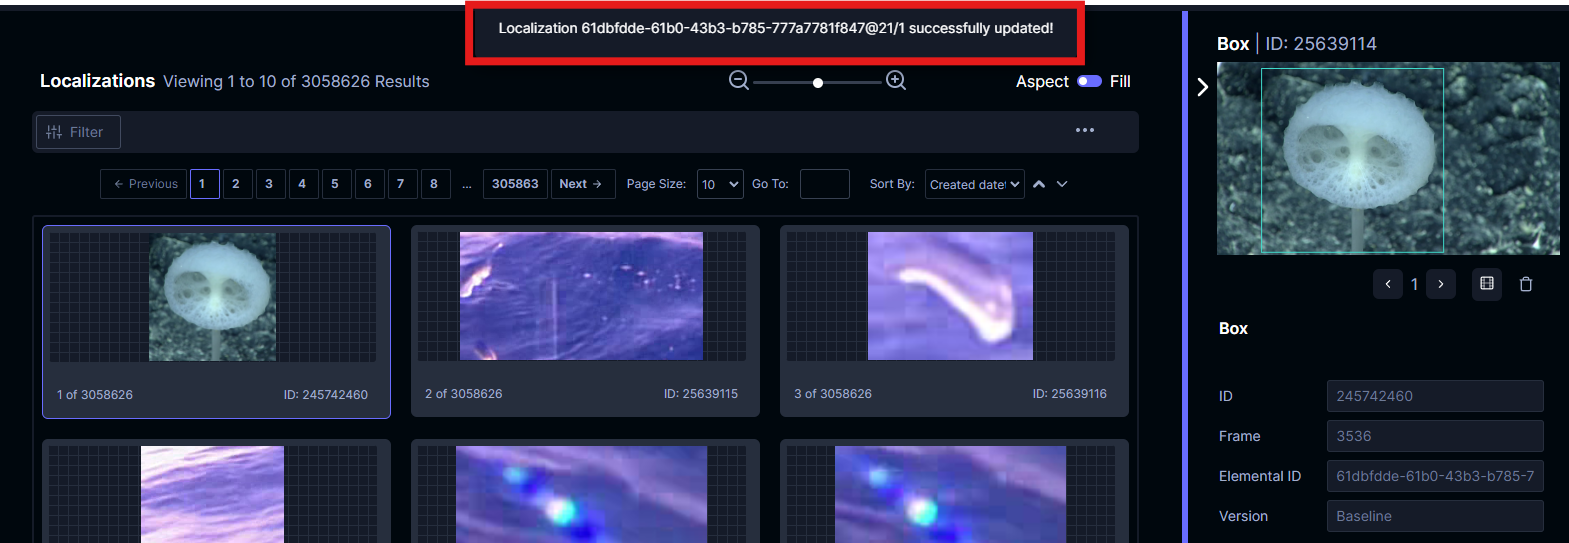
Below the image are the localization’s attributes and the associated media’s attributes. Viewing and editing these attributes in this analytics view behaves like the annotator view. One difference is editing attributes are locked by default. To enable editing of attributes, click the lock button in the settings header to toggle editing. Both the localization’s attributes and the media’s attributes can be edited and if successful, a check-mark status message will pop up at the top of the page.
Attributes typically not visible in the annotator view are also accessible in this panel. The localization’s built-in attributes (frame, dtype, version, modifications, and dimensions) are visible here. If available, hidden attributes (i.e., attributes whose order are less than 0) are also accessible in this panel. Click on the Built-in Attributes and Hidden Attributes links to access them.